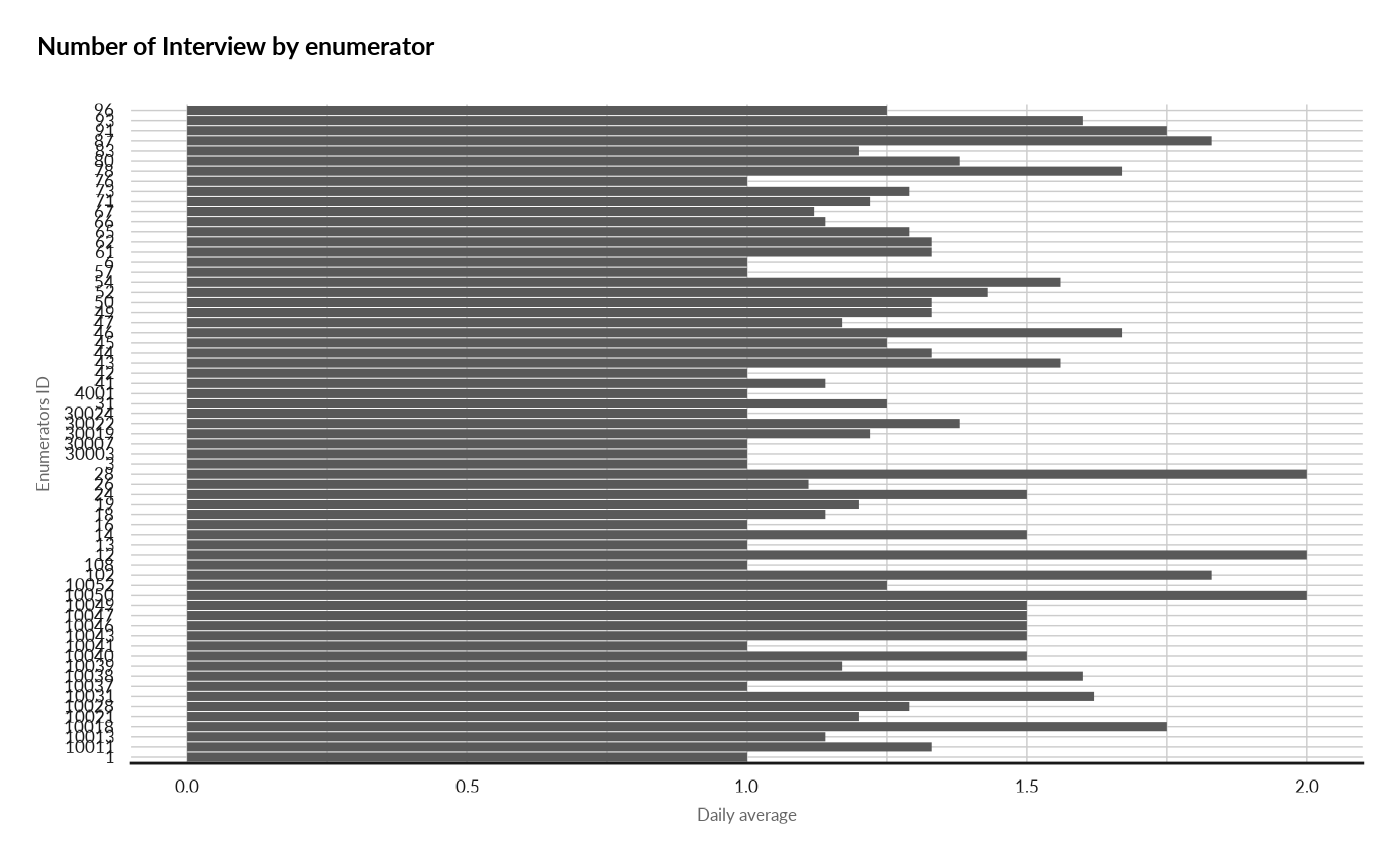
Check the number of Interview by enumerator
Source:R/enumeratorproductivity.R
enumeratorProductivity.RdThis function display the total number of survey made and the average per day per enumerator.
Arguments
- ds
dataset containing the survey (from kobo): labelled data.frame
- surveyDate
name of the field in the dataset where the date of the survey is stored: string
- enumeratorID
name of the field where the enumerator ID is stored: string
- checkperiod
if not null number of day before today when the check should be made
- surveyConsent
name of the field in the dataset where the survey consent is stored: string
- consentForValidSurvey
value defined in the kobo form to acknowledge the surveyed person gave his consent: string
Value
result a list that includes: * dst same dataset as the inputed one but with survey marked for deletion if errors are found and delete=TRUE (or NULL) * ret_log list of the errors found (or NULL) * var a list of value (or NULL) * graph graphical representation of the results (or NULL)
Examples
load(system.file("sample_dataset.RData", package = "HighFrequencyChecks"))
ds <- sample_dataset
surveyDate <- "survey_date"
enumeratorID <- "enumerator_id"

result <- enumeratorProductivity(ds = ds,
                                 surveyDate=surveyDate,
                                 enumeratorID=enumeratorID)

knitr::kable(head(result[["ret_log"]], 10))
#>
#>
#> | enumerator_id| days_worked| total_surveys_done| daily_average|
#> |-------------:|-----------:|------------------:|-------------:|
#> |             1|           2|                  2|          1.00|
#> |             3|           2|                  2|          1.00|
#> |             6|           2|                  2|          1.00|
#> |            12|           3|                  6|          2.00|
#> |            13|           6|                  6|          1.00|
#> |            14|           8|                 12|          1.50|
#> |            16|           9|                  9|          1.00|
#> |            18|           7|                  8|          1.14|
#> |            19|           5|                  6|          1.20|
#> |            24|           4|                  6|          1.50|
print(result[["graph"]])