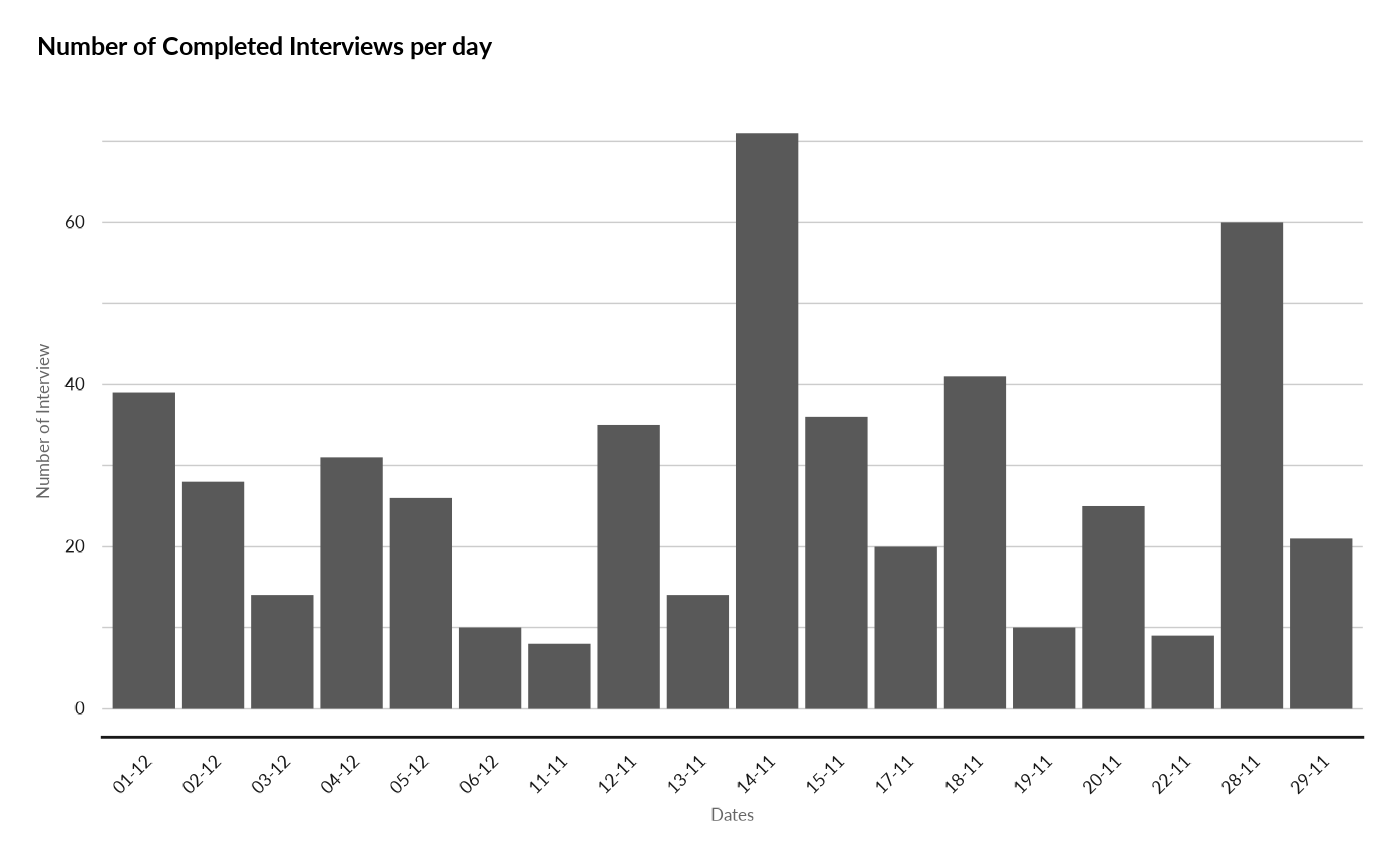
This function display the number of interview conducted per day.
Usage
assessmentProductivity(
  ds = NULL,
  surveyDate = NULL,
  dateFormat = NULL,
  surveyConsent = NULL
)
Arguments
- ds
dataset containing the survey (from kobo): labelled data.frame
- surveyDate
name of the field in the dataset where the date of the survey is stored: string
- dateFormat
format used for the date: string ('%m/%d/%Y')
- surveyConsent
name of the field in the dataset where the survey consent is stored: string
- checkperiod
if not null number of day before today when the check should be made
- consentForValidSurvey
value defined in the kobo form to acknowledge the surveyed person gave his consent: string
Value
result a list that includes: * dst same dataset as the inputed one but with survey marked for deletion if errors are found and delete=TRUE (or NULL) * ret_log list of the errors found (or NULL) * var a list of value (or NULL) * graph graphical representation of the results (or NULL)
Examples
load(system.file("sample_dataset.RData", package = "HighFrequencyChecks"))
ds <- sample_dataset
surveyDate <- "survey_date"
dateFormat <- "%m/%d/%Y"
surveyConsent <- "survey_consent"
result <- assessmentProductivity(ds = ds,
                                                       surveyDate = surveyDate,
                                                       dateFormat = dateFormat,
                                                       surveyConsent = surveyConsent)
knitr::kable(head(result[["ret_log"]], 10))
#>
#>
#> |surveydate | NbSurvey|
#> |:----------|--------:|
#> |01-12      |       39|
#> |02-12      |       28|
#> |03-12      |       14|
#> |04-12      |       31|
#> |05-12      |       26|
#> |06-12      |       10|
#> |11-11      |        8|
#> |12-11      |       35|
#> |13-11      |       14|
#> |14-11      |       71|
print(result[["graph"]])