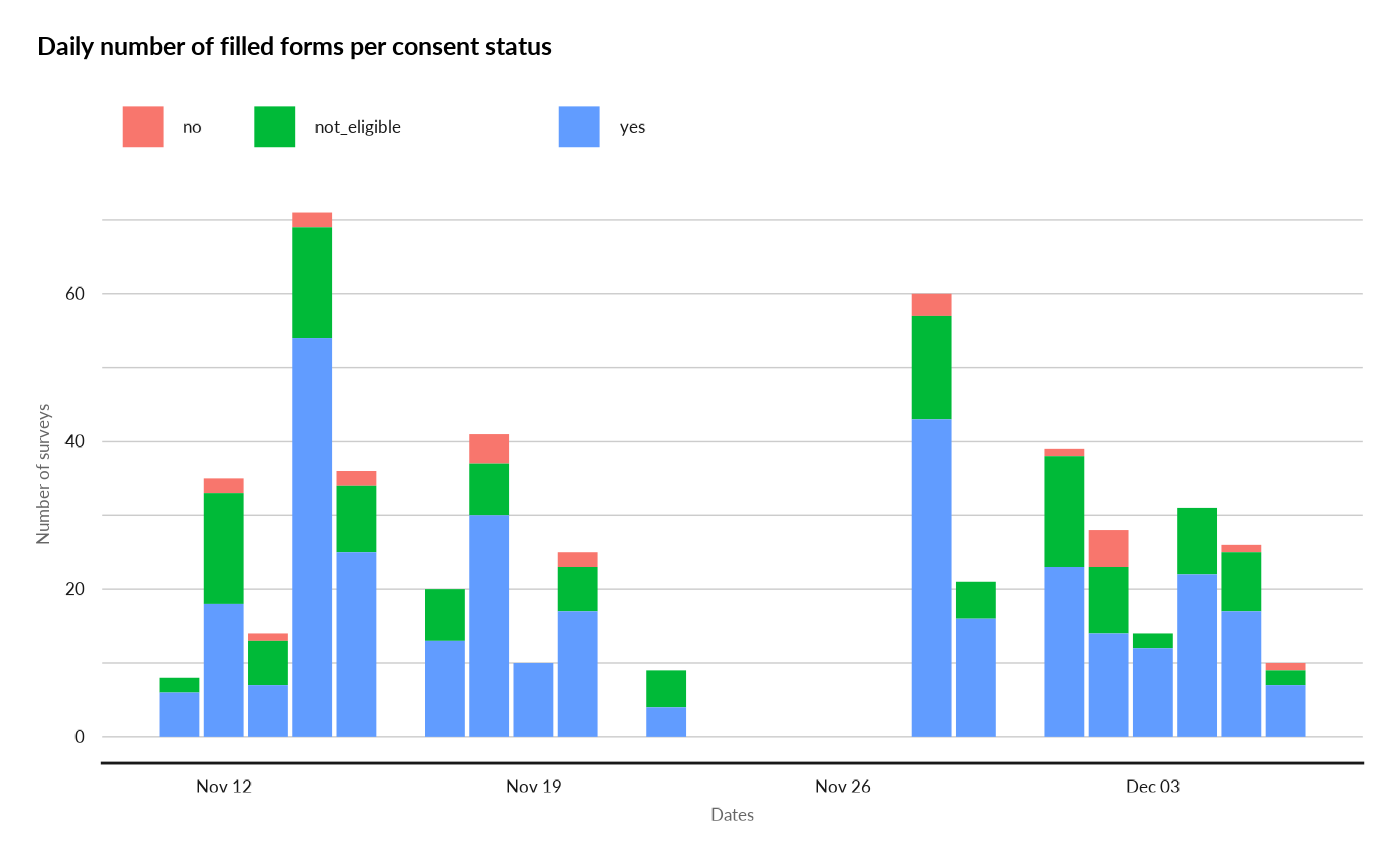
Daily number of filled forms per consent status
Source:R/assessmentinterviewtime.R
assessmentInterviewTime.RdThis function display the number of filled forms conducted per day per consent status.
Usage
assessmentInterviewTime(
  ds = NULL,
  surveyDate = NULL,
  dateFormat = NULL,
  surveyConsent = NULL
)
Arguments
- ds
dataset containing the survey (from kobo): labelled data.frame
- surveyDate
name of the field in the dataset where the date of the survey is stored: string
- dateFormat
format used for the date: string ('%m/%d/%Y')
- surveyConsent
name of the field in the dataset where the survey consent is stored: string
- consentForValidSurvey
value defined in the kobo form to acknowledge the surveyed person gave his consent: string
- attempt
name of the field in the dataset where the interview attempt output is stored: string
Value
result a list that includes: * dst same dataset as the inputed one but with survey marked for deletion if errors are found and delete=TRUE (or NULL) * ret_log list of the errors found (or NULL) * var a list of value (or NULL) * graph graphical representation of the results (or NULL)
Examples
load(system.file("sample_dataset.RData", package = "HighFrequencyChecks"))
ds <- sample_dataset
surveyDate <- "survey_date"
dateFormat <- "%m/%d/%Y"
surveyConsent <- "survey_consent"
result <- assessmentInterviewTime(ds = ds,
                                      surveyDate=surveyDate,
                                      dateFormat=dateFormat,
                                      surveyConsent=surveyConsent)

knitr::kable(head(result[["ret_log"]], 10))
#>
#>
#> |surveydate | no| not_eligible| yes|
#> |:----------|--:|------------:|---:|
#> |2018-11-11 |  0|            2|   6|
#> |2018-11-12 |  2|           15|  18|
#> |2018-11-13 |  1|            6|   7|
#> |2018-11-14 |  2|           15|  54|
#> |2018-11-15 |  2|            9|  25|
#> |2018-11-17 |  0|            7|  13|
#> |2018-11-18 |  4|            7|  30|
#> |2018-11-19 |  0|            0|  10|
#> |2018-11-20 |  2|            6|  17|
#> |2018-11-22 |  0|            5|   4|
print(result[["graph"]])