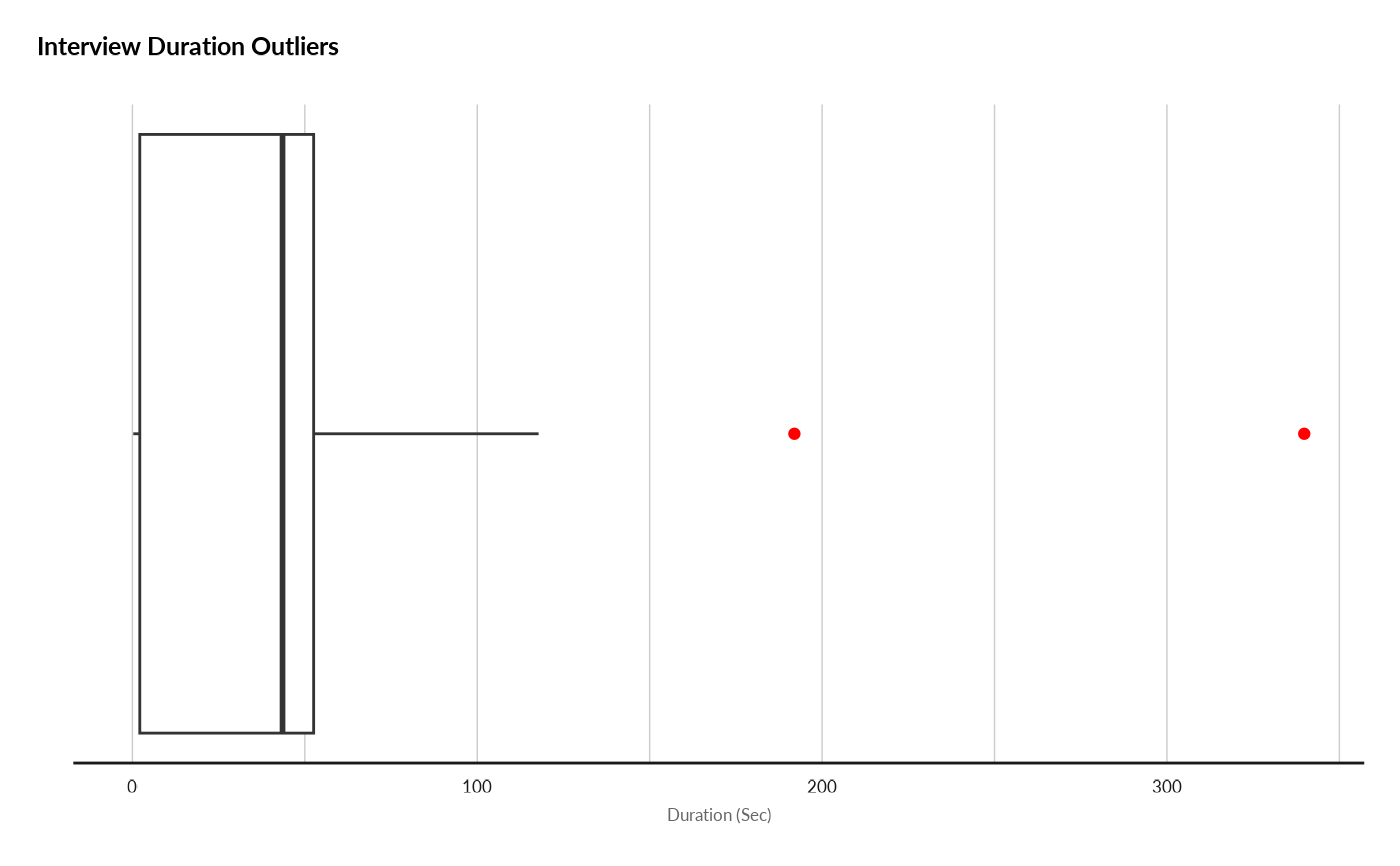
Report the outlier durations for the surveys
Source:R/assessmentdurationoutliers.R
assessmentDurationOutliers.RdThis function report the outlier durations for the surveys
Usage
assessmentDurationOutliers(
  ds = NULL,
  dates = NULL,
  sdval = 2,
  attempt = NULL,
  startDataCollection = NULL,
  reportingColumns = c(enumeratorID, uniquerespondantID)
)
Arguments
- ds
dataset containing the survey (from kobo): labelled data.frame
- dates
name of the fields where the information about the start and end date of the survey is stored: list of string (c('start_date','end_date'))
- sdval
(Optional, by default set to 2) number of standard deviation for which the data within is considered as acceptable: integer
- attempt
name of the field in the dataset where the interview attempt output is stored: string
- startDataCollection
Date when the data collections started
- reportingColumns
(Optional, by default it is built from the enumeratorID and the uniquerespondantID) name of the columns from the dataset you want in the result: list of string (c('col1','col2',...))
- checkperiod
if not null number of day before today when the check should be made
- uniquerespondantID
name of the field where the survey unique ID is stored: string
- enumeratorID
name of the field where the enumerator ID is stored: string
- surveyConsent
name of the field in the dataset where the survey consent is stored: string
- consentForValidSurvey
value defined in the kobo form to acknowledge the surveyed person gave his consent: string
Value
result a list that includes: * dst same dataset as the inputed one but with survey marked for deletion if errors are found and delete=TRUE (or NULL) * ret_log list of the errors found (or NULL) * var a list of value (or NULL) * graph graphical representation of the results (or NULL)
Examples
load(system.file("sample_dataset.RData", package = "HighFrequencyChecks"))
ds <- sample_dataset
dates <- c("survey_start","end_survey")
uniquerespondantID <- "X_uuid"
enumeratorID <- "enumerator_id"
reportingColumns <- c(enumeratorID, uniquerespondantID)
sdval<-2
result <- assessmentDurationOutliers(ds = ds,
                                     dates=dates,
                                     sdval=sdval,
                                     reportingColumns=reportingColumns)
#> Loading required package: ggplot2

knitr::kable(head(result[["ret_log"]],10))
#>
#>
#> | enumerator_id|X_uuid                               |surveytime    |zscore         |
#> |-------------:|:------------------------------------|:-------------|:--------------|
#> |            52|d18cc342-3e4f-46a2-8ed1-cf4c2bb73ab9 |107.4667 secs |2.458512 secs  |
#> |            93|7adab422-2c20-4552-beaf-16f1aa831b82 |113.0833 secs |2.651431 secs  |
#> |            18|25291b40-5a3b-486c-ad4f-52e38939234f |191.9667 secs |5.360887 secs  |
#> |         10049|a6a28f3c-08e7-4f7e-9826-008816ea596d |117.7833 secs |2.812865 secs  |
#> |         10021|a05f7999-53c4-4ab6-a243-2a1a86edde6c |339.8167 secs |10.439184 secs |
#> |         10037|f597f78d-967b-4f95-8bd2-356e1f07e1b0 |103.3000 secs |2.315397 secs  |
#> |            96|aaf61dda-d04f-4936-9895-f80fae57c247 |102.6333 secs |2.292499 secs  |
print(result[["graph"]])